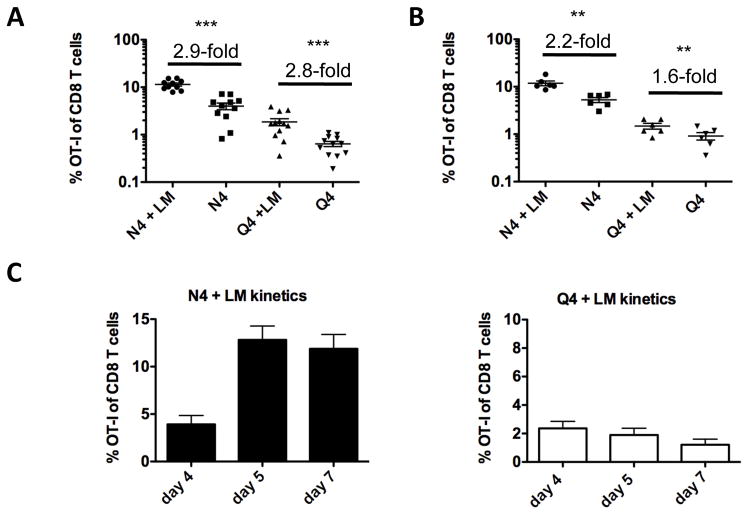
Fig. 1. Impact of inflammation and TCR signal strength on the size, function and phenotype of the primary response.
C57BL/6 mice were injected intravenously (i.v.) with 1×10⁶ N4 or Q4 peptide pulsed DCs and 1×10⁴ naïve OT-I T cells (Thy1.1) with or without an accompanying wild-type Listeria monocytogenes (LM) infection. The frequency of OT-I T cells of total CD8 T cells (A) in the blood and (B) in the spleen was determined 5 days later and fold increase of N4 and Q4 primed OT-I T cells (+/− LM) was calculated. Data shown are representative for at least 5 independently performed experiments with a minimum of 3 mice per group. Horizontal bars represent the mean. (C) The frequency of OT-I T cells in the blood is shown on days 4, 5 and 7 after priming with N4 peptide pulsed DCs + LM and Q4 peptide pulsed DCs + LM. Data shown are pooled from 2 independently performed experiments with a minimum of 3 mice per group. Statistical significance was determined by student t-test. p-values >0.05 were considered not significant (ns), 0.01 to 0.05 significant (*), 0.001 to 0.01 very significant (**) and <0.001 extremely significant (***).

