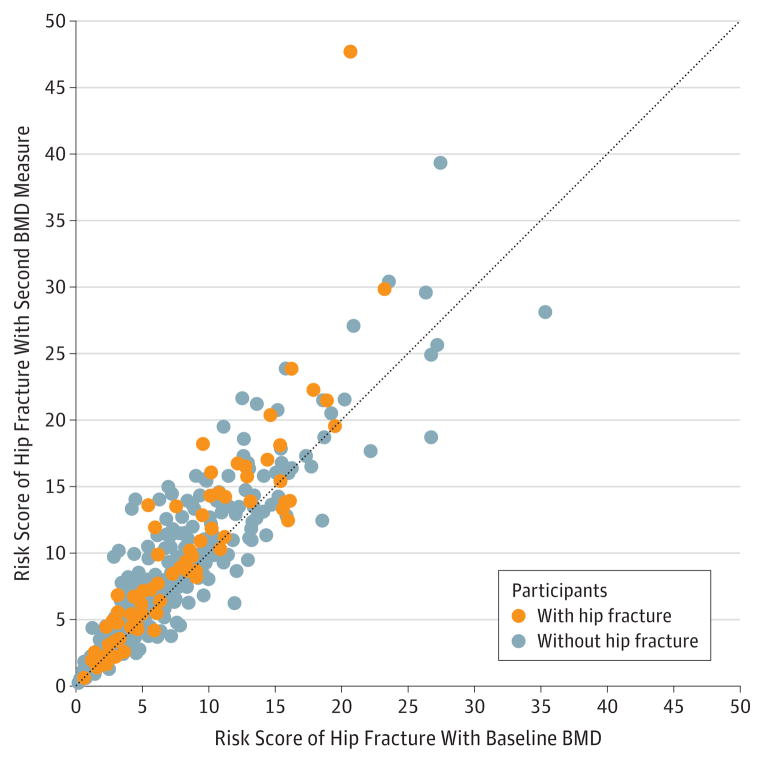
Figure 2. Scatterplot Showing the Distribution of Risk Scores of Hip Fracture With Baseline BMD vs Risk Scores of Hip Fracture and the Second BMD Measure.
BMD indicates bone mineral density. Risk scores of hip fracture are calculated with updated clinical characteristics. The dotted line indicates no change between the 2 risk assessment estimates (ie, BMD is unchanged).

