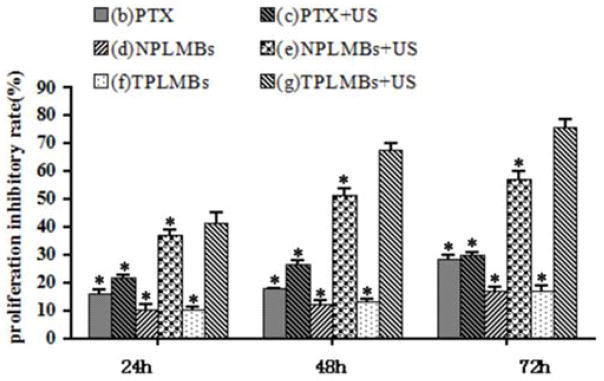
Figure 3.

Growth inhibition effect of A2780/DDP cells with different treatments. The proliferation inhibitory rate of cells was determined by MTT 24,48 and 72h after treatment. Data are represented as mean ± SD (n=3). The proliferation inhibitory rate of the PLMBs +US groups and TPLMBs +US groups are significantly higher than those of the other groups (p<0.05). The proliferation inhibitory rate of TPLMBs +US group is higher than PLMBs +US group at 24, 48 and 72h after treatment (p<0.05). Compared with group (g), *p<0.05.
