
Figure 5.
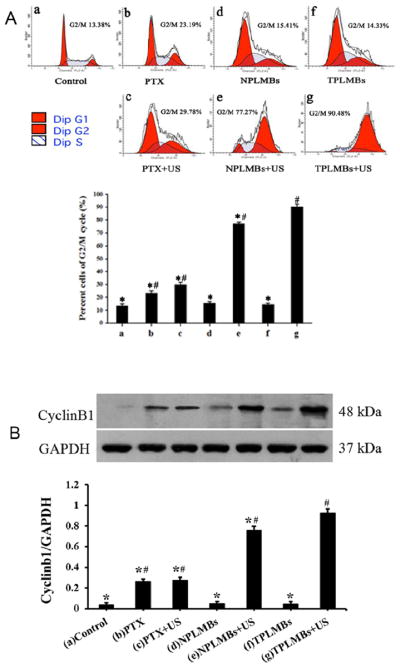
The cell cycle arrest in A2780/DDP cells with different treatments. (A) Cell cycles were detected by flow cytometry 24 h after treatment. G2/M phase is significantly increased and S phase is decreased in PLMBs +US group and TPLMBs +US group than the other groups (p < 0.05). G2/M phase is of TPLMBs +US group is higher than PLMBs +US group and S phase is lower than PLMBs +US group (p<0.05). (B) Western blot analysis of the expression of cyclinB1 protein in A2780/DDP cells after different treatments. CyclinB1 protein expression was analyzed by Western blot 24 h after transfection. Cells treated with ultrasound-targeted PLMT destruction showed more prominent bands than other treatment groups (P<0.05). GAPDH was used as an internal reference. Compared with group (g), *P<0.05; Compared with group (a), #P<0.05.