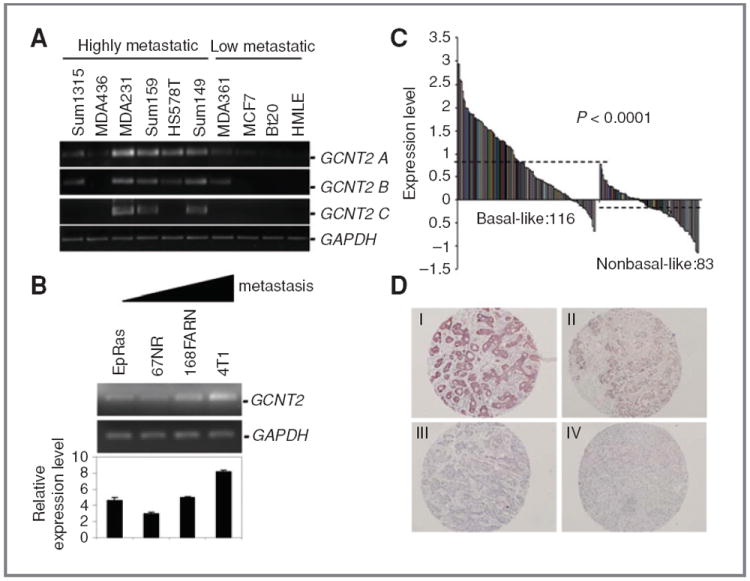
Figure 1.

Expression pattern of GCNT2 in breast cancer. A, the expression pattern of 3 isoforms of GCNT2 in human breast cancer cell lines. The highly (+) and low (−) metastatic breast cancer cell lines are marked as indicated. B, GCNT2 RNA expression in a set of mouse cell lines with different metastatic capabilities. The triangular bar indicates the increase in metastatic capability. C, the expression level of GCNT2 in breast tumor samples (basal-like sample, 116 cases and nonbasal-like sample, 83 cases). Dashed lines indicate the average expression level. D, expression of GCNT2 protein in breast tumors. The panels show representative figures of the IHC assay. I is an example of strong staining. II is intermediate staining. III is weak staining. IV is no staining.
