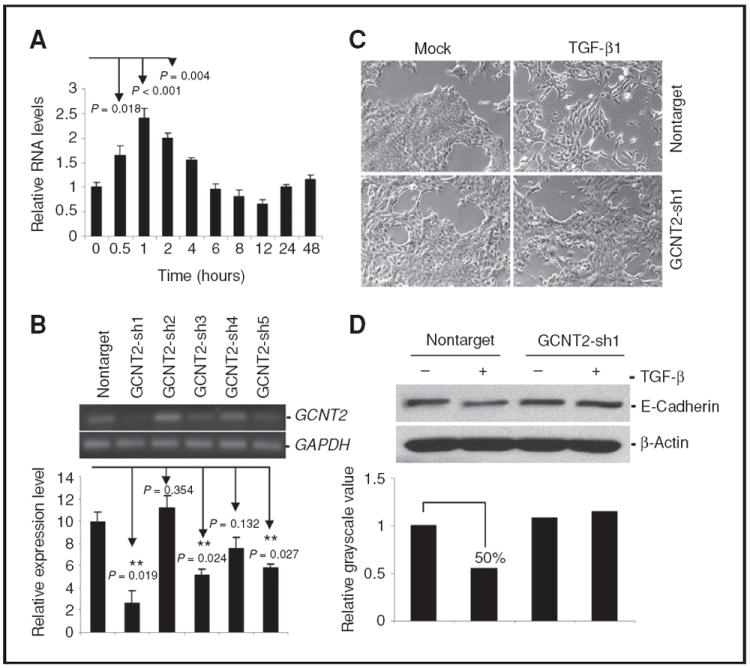
Figure 6.

The involvement of GCNT2 in TGF-β signaling. A, induction of GCNT2 by TGF-β1. NMuMG cells were treated with 5 ng/mL TGF-β1 for 2 days. GCNT2 expression is confirmed by quantitative real-time RT-PCR. B, knockdown of GCNT2 in NMuMG cells with shRNA was confirmed by RT-PCR (top) and real-time RTPCR (bottom). C, representative pictures show the morphologic change after treatment of TGF-β1 in NMuMG cells with nontarget vector and shRNA1. D, Western blotting results show the effect of GCNT2 on E-cadherin expression after TGF-β1 treatment in NMuMG cells with nontarget control and shRNA1. The lower panel shows the quantification of the signal intensity.
