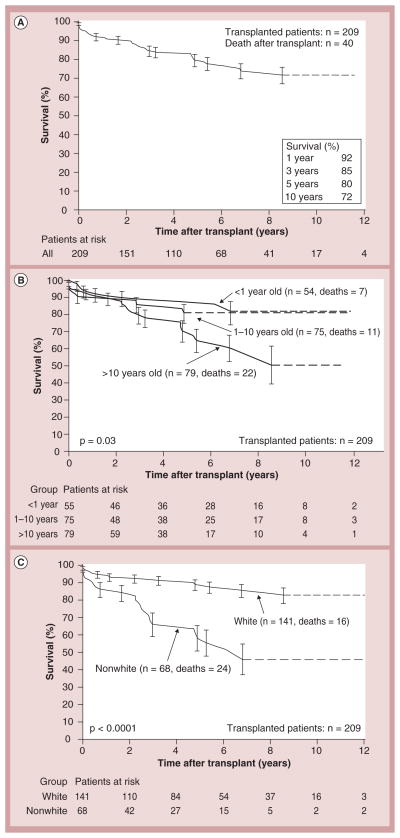
Figure 10. Kaplan–Meier post-transplantation survival curve. (A).
Children with dilated cardiomyopathy (n = 209); (B) children <1, 1–10 and >10 years of age at transplantation; and (C) nonwhite versus white children. Error bars represent 70% confidence limits. Dashes are included where there is an insufficient sample size to continue the Kaplan–Meier curves.
Reproduced with permission from [26].

