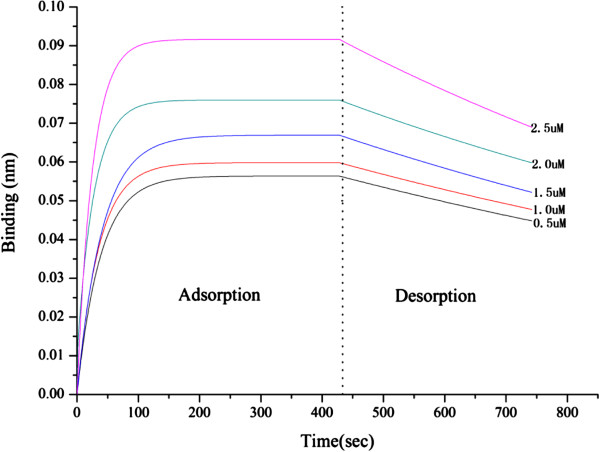
Figure 6.
The vertical and horizontal axes represent the light shift distance (nm) of different concentrations of HSA in the solution and adsorption/desorption time (sec), respectively. The desorption constant Kd (1.42 μmol/L) was calculated from the adsorption and desorption curves of HSA from PNBN-T.

