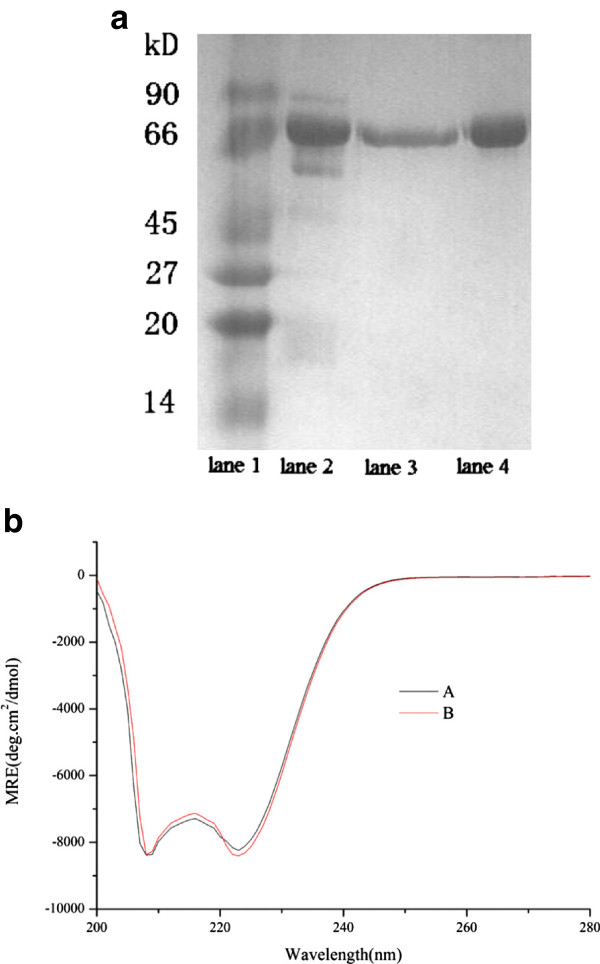
Figure 7.
The SDS-PAGE and CD Spectra results of affinity precipitation. a Purification effect of HSA with affinity precipitation with 1 mol/L NaSCN as the eluent. Lane 1: Protein markers, Lane 2: human serum, Lane 3: HSA after purification, Lane 4: pure HSA. b The CD Spectra of HSA, obtained in 1.0 μmol/L PBS at pH 7.0 and room temperature. HSA concentration was fixed at 10.0 μmol/L. (A), pure HSA (B), purified HSA.

