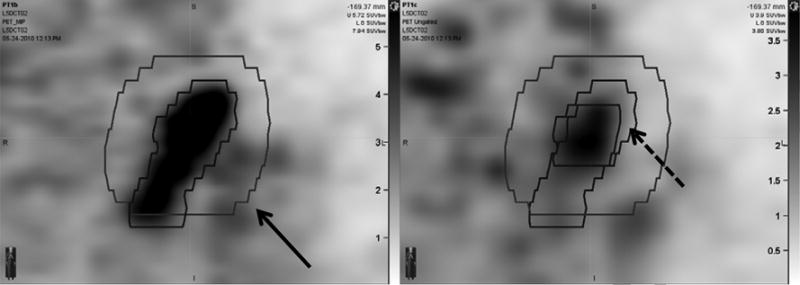
Figure 1.

4D-PET MIP image (left) and un-gated PET image (right) of a para-aortic lymph node (node 1 of patient 2). Internal target volumes based on 4D-PET and on un-gated PET with a 1 cm expansion (solid arrow) are shown superimposed. The un-expanded contour drawn on the un-gated PET image is shown on the right panel (dashed arrow). The intensity scale on the left panel ranges from 0 to 5.73 SUV. The intensity scale on the right panel ranges from 0 to 3.9 SUV. Intensity scales for this display were chosen to match background levels in the PET-MIP and un-gated PET images. Contouring was performed with dynamically adjusted window-level settings.
