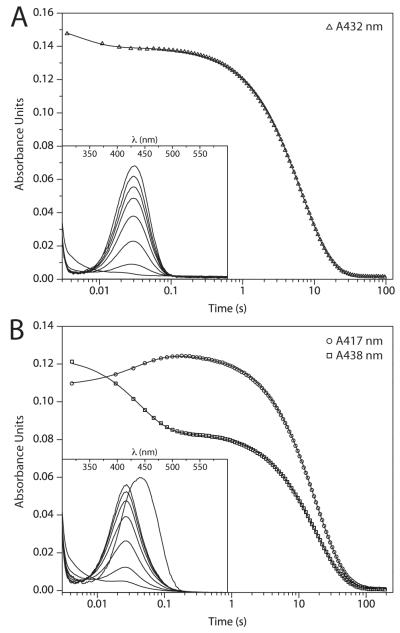
Figure 3.
Results from representative stopped-flow experiments demonstrating the turnover of 4 μM 3-Cl HOPDAs by 16 μM DxnB2 in potassium phosphate (I = 0.1 M), pH 7.5 at 25 °C. (A) Hydrolysis of 3-Cl HOPDA monitored at 432 nm. (B) Hydrolysis of 3,9,11-triCl HOPDA monitored at 417 and 438 nm. For each substrate, the accumulation of intermediates as revealed by monitoring time-dependent changes to the visible spectrum from 300 to 600 nm with a PDA is inset.

