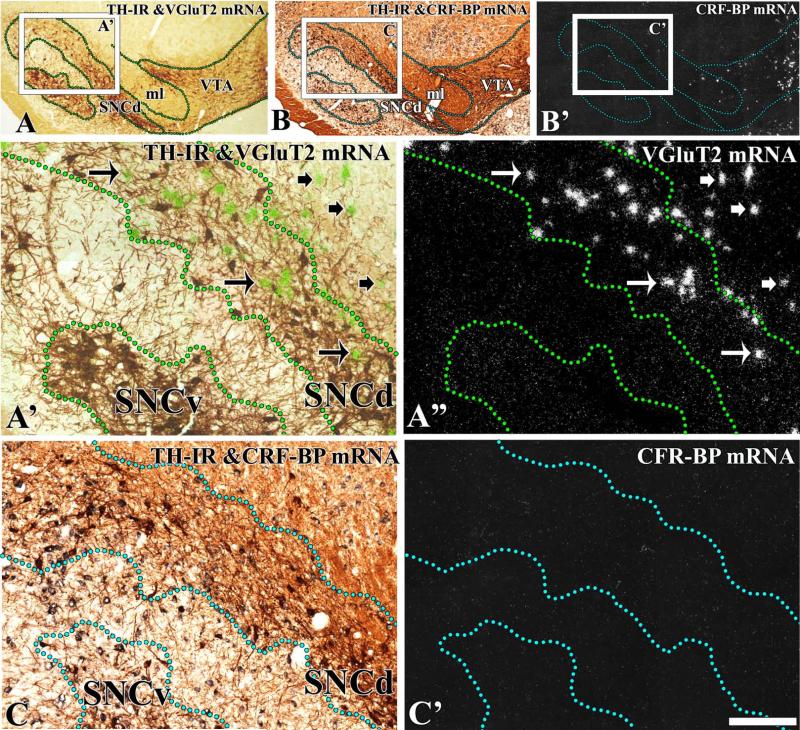
Fig. 3.
Expression of VGluT2 mRNA in the SNC at the caudal level (–6.0 mm from bregma). Coronal sections were incubated with anti-TH antibodies and hybridized with antisense riboprobes for detection of VGluT2 (A–A″’) or CRF-BP (B–C′). (A) Section at low magnification showing TH immunoreactivity (TH-IR) under bright-field microscopy. The delimited area in A is shown at higher magnification under bright-field/epiluminescence microscopy (A′) and under epiluminescence microscopy (A″). Outlines demarcate the dorsal (SNCd) or the ventral (SNCv) portions of the SNC. The TH neurons cells are seen as brown cells, and the VGluT2 neurons as green grain aggregates (arrows in A′) under bright-field/epiluminescence microscopy. These VGluT2 neurons are seen as silver grain aggregates (arrows in A″) under epiluminescence microscopy. Long arrows indicate examples of VGluT2 neurons intermingled with TH neurons. Short arrows indicate examples of VGluT2 neurons intermingled with TH dendrites. VGluT2 neurons are seen in the SNCd, but not in the SNCv. (B and B′) At low magnification, note expression of CRF-BP mRNA in the VTA, but not in the SNC. Delimited areas in B and B′ are shown at higher magnification in C and C′. There is a lack of CRF-BP in the SNCd and SNCv (C′). ml. The scale bar shown in C′ is 625 μm for A–B′ and 150 μm for A′–C′.

