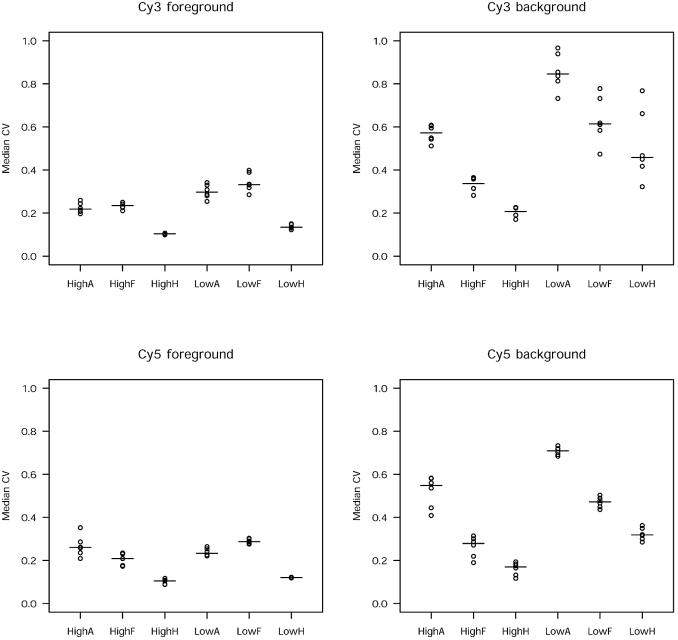
Figure 2.
The histogram method yields less pixel-to-pixel variability compared to other methods of segmentation. The dot plot shows the distribution of median within-spot CV values by segmentation method and low and high amounts of labelled probe. The medians are indicated by horizontal lines (A, adaptive; F, fixed circle; H, histogram; low, experiment A; high, experiment B).

