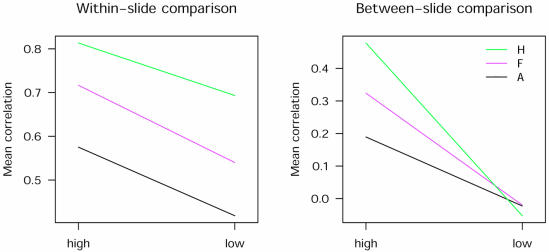
Figure 4.
Histogram segmentation improves within- and between-slide correlations. Interaction plots show the effect of the amount of labelled probe on the mean correlations for all data from experiments A and B for each of the three segmentation methods. Left and right panels show within-slide (six data points per category) and between-slide correlations (15 data points per category). The amount of labelled probe has a significant effect (P < 0.001) as indicated by the downward slope of the lines from high to low amounts. In between-slide comparisons, the benefit of histogram segmentation is confounded by low amounts of labelled probe (A, adaptive; f, fixed circle; H, histogram).

