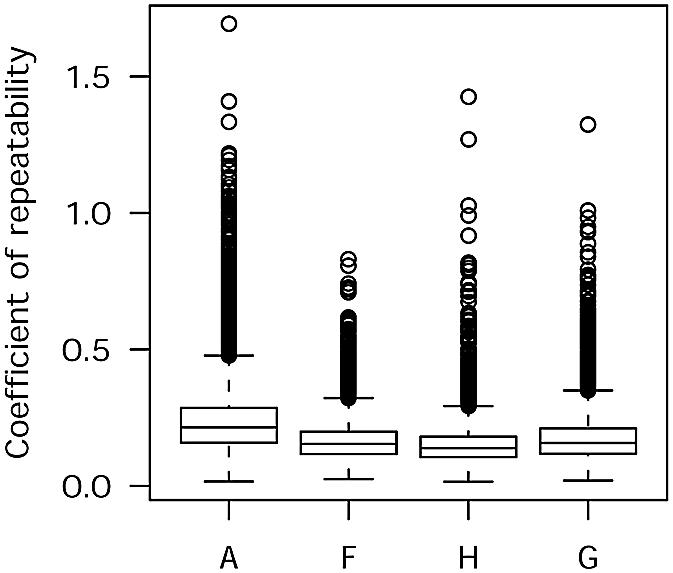
Figure 5.

Histogram segmentation results in the lowest coefficient of repeatability (CR). Box plots show the distribution of the CR values of each of the 6528 spots in experiment B by four different methods of segmentation (A, adaptive; F, fixed circle; H, histogram; G, GenePix).
