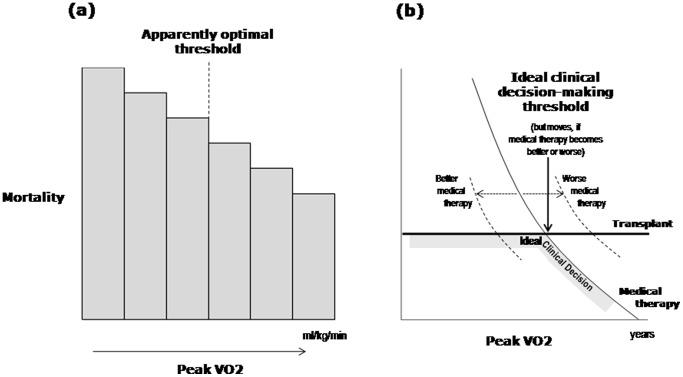
Figure 7. Example of use of flexible non-linear function to describe the relationships between age (left) and peak VO2 (right) and log odds of death using 208 patients.
The shaded areas represent the 95% confidence intervals for this function. Flexible non-linear functions have numerous benefits over categorization, including improved precision, avoidance of assumption of a discontinuous relationship, maximisation of applicability to the individual and importantly avoidance of giving other variables or interactions artificially high weights. Inspection of the resulting plots above can make obvious the lack of a discontinuity in risk.

