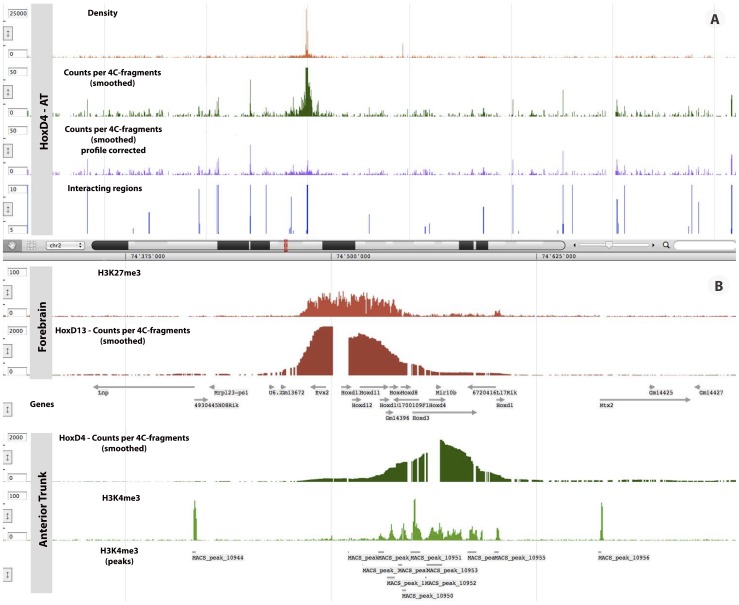
Figure 6. Chromatin configuration and transcriptional status in the HoxD cluster.
A) Illustration of the successive steps of a 4C-seq analysis. From top to bottom: coverage profile (reads density) is smoothed by a moving average. The smoothed density is corrected by fitting a model of the local interaction profile and long-range interacting regions are identified with the domainogram algorithm. B) From top to bottom: smoothed 4C-seq profiles for Hoxd13 and Hoxd4 in AT; the ChIP-seq density profiles of H3K27me3 and H3K4me3 in the same tissues with the peaks of H3K4me3 found by MACS. This figure was generated with the GDV genome viewer.

