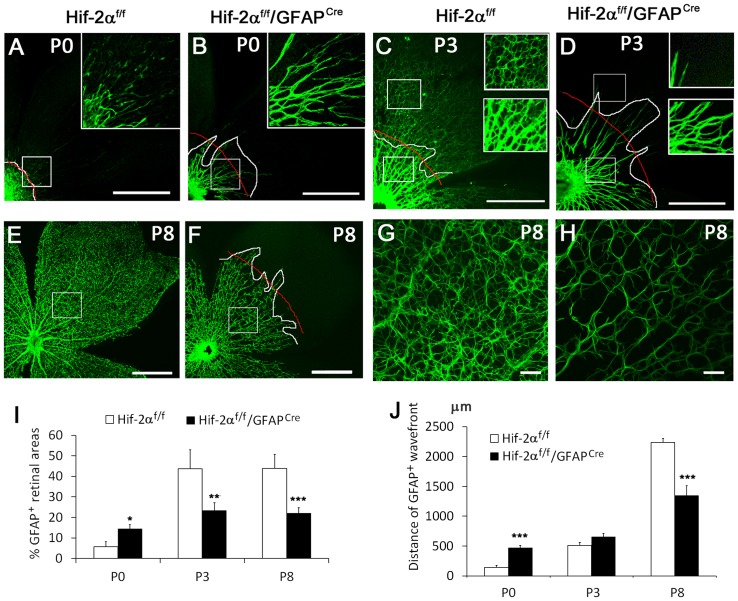
Figure 5. Precocious but tapered development of the astrocytic network in Hif-2αf/f/GFAPCre mice.
Astrocyte development was examined by anti-GFAP IF staining. A and B. Anti-GFAP staining at P0. In A, GFAP+ cells are mostly limited to the optic nerve head (lower left). In Hif-2αf/f/GFAPCre mice, GFAP+ structures extended much further. White lines demarcate the borderline between strongly GFAP+ and the rest of retinal areas. Red lines mark the approximate average position of the white line. Boxed areas are shown in higher magnifications in the insets. C and D. Anti-GFAP staining at P3. Upper and lower insets are expanded from corresponding boxes. E to H. Anti-GFAP stained retinas at P8 shown at low (E and F) and high (G and H) magnifications. Scale bars, 500 µm in A to F, 50 µm in G and H. I. Percentage (%) of GFAP+ areas. Quantifications were carried out in white boxes in A, B, E and F, and lower boxes in C and D. Three such areas were quantified per mouse and average values were used as one data point. J. Quantification of GFAP+ wavefronts to the optic nerve, measured as distances between red curves and optic nerves. n = 5. * p<0.05, ** p<0.01, *** p<0.001.

