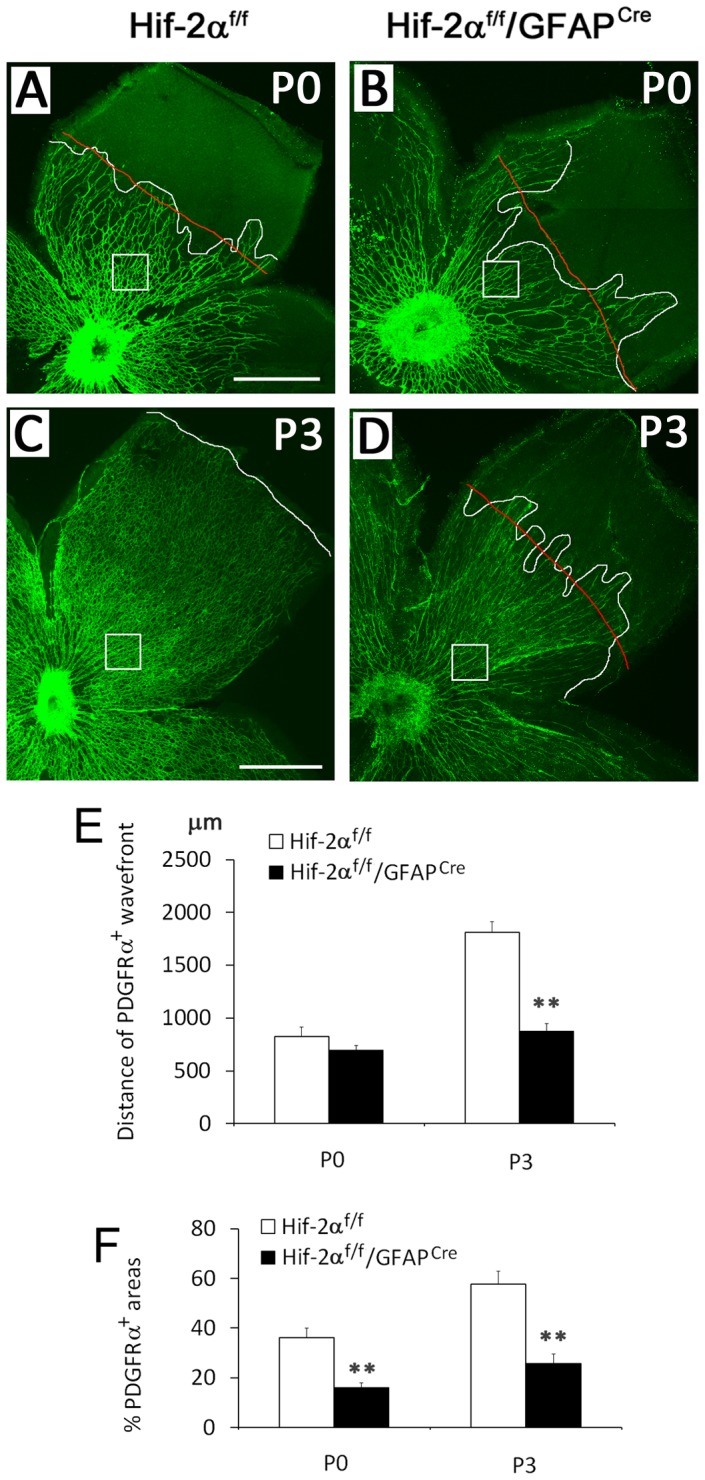
Figure 6. Reduced number of PDGFRα+ astrocytes in Hif-2αf/f/GFAPCre mice.

A to D. Retinas dissected at P0 and P3 were subject to anti-PDGFRα IF staining. Wavefronts of PDGFRα+ astrocytes are marked by white lines. Red lines represent the approximate average positions of the zigzag white lines. In C, no red line is provided because the front of PDGFRα+ astrocyte network was relatively even. Areas indicated by white boxes were quantified for percentage of PDGFRα+ tissues. E. Distance from optic nerve head to the front of PDGFRα+ areas (white line in C, or red lines in A, B, and D). F. Percentage of PDGFRα+ retinal areas. Quantifications were carried for areas indicated by white boxes, taking the average of three such areas from the same mouse as one data point. Scale bars are 500 µm. n = 4. ** p<0.01.
