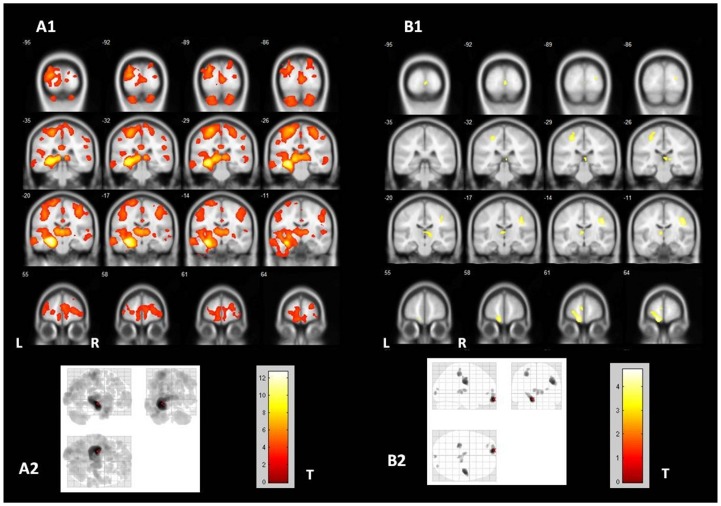
Figure 1. Gray matter atrophy in TLE-HS and TLE-NL.
VBM demonstrated significant areas of diffuse gray matter volume loss in TLE-HS and TLE-NL. A1 and A2 (“glass view”) show the areas of gray matter atrophy in TLE-HS (two-sample T-test, p<0.001, uncorrected, minimum threshold cluster of 30 voxels); B1 and B2 (“glass view”) show the areas of gray matter atrophy in TLE-NL (two-sample T-test, p<0.001, uncorrected, minimum threshold cluster of 30 voxels). TLE-HS: temporal lobe epilepsy with MRI signs of hippocampal sclerosis; TLE-NL: temporal lobe epilepsy with normal MRI; VBM: voxel based morphometry; T: t-value; L: left; R: right.

