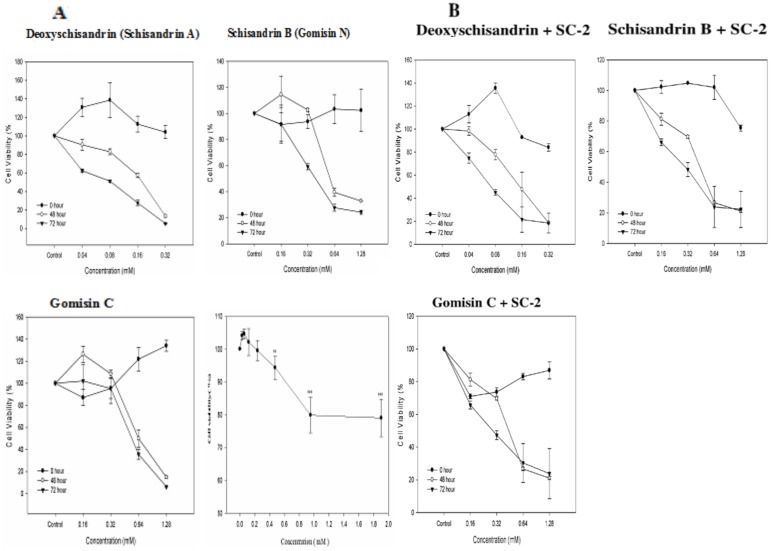
Figure 5. Effect of free lignans and the peptidylglycan SC-2 on HepG2 cell viability.
The cell viability affected by the free lignans and SC-2 (A). And the cell viability affected by the combined therapy of ligna+SC-2 (B). For free SC-2 in figure 5A, the cells were cultured in 10% FBS medium and treated with SC-2 at dosages 0.0297 mM, 0.0595, 0.1189, 0.2378, 0.4756, 0.9512, and 1.9024 mM, respectively for 48 h. The percent cell viability was calculated by comparing with the control (arbitrarily set as 100%) Values are expressed as mean±S.D. of triplicate independent experiments (**p<0.01 and ***p<0.001 vs control group).

