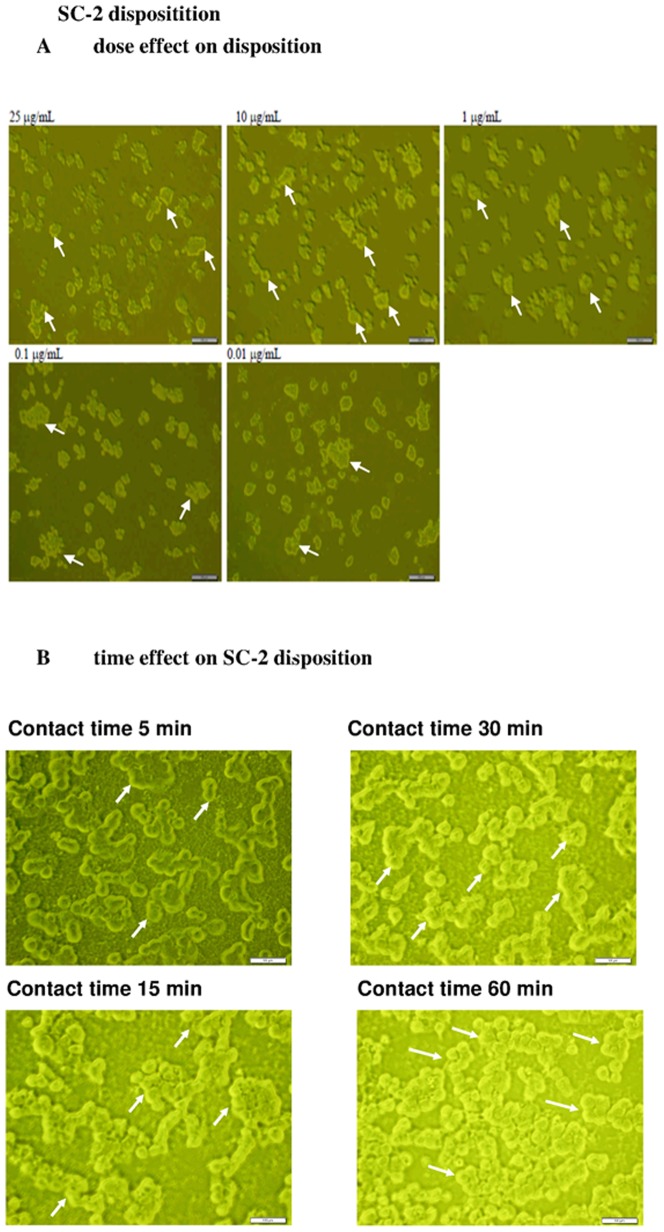
Figure 6. Fluorescent labeling technique to investigate the intracellular deposition of SC-2 into the HepG2 cells (×400).
The dose effect (A), and the time effect (B). SC-2 was covalently labeled in equimolar ratio with FITC to form FITC-SC-2. In experiment A: Hep G2 cells at 1×10⁵ cells/mL were seeded onto 3.5 cm plate containing 2 mL of DMEM and incubated for 24 h. FITC-SC-2 at 0.01, 0.1, 1.0, 10, and 25 µg/mL was added, and the incubation was continued for 30 min. In experiment B: Hep G2 cells at 1×10⁵ cells/mL were seeded onto 3.5 cm plate containing 2 mL of DMEM and incubated for 24 h. FITC-SC-2 (10 µg/mL) was added, and the incubation was continued and sampled at the hour as indicated. As seen, in both experiments the FITC-SC-2 probes remained exclusively onto the outer membrane. Blank arrows indicate the non-fluorescent intracellular compartment.

