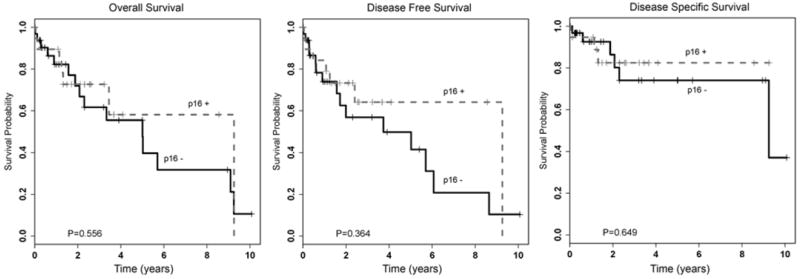
FIGURE 3.

Kaplan-Meier survival curves for p16-positive and p16-negative patient cohorts. (p16 positive, >50% of tumor cells with nuclear and cytoplasmic staining; p16 negative, no tumor cell staining or staining in <50% of tumor cells).

Kaplan-Meier survival curves for p16-positive and p16-negative patient cohorts. (p16 positive, >50% of tumor cells with nuclear and cytoplasmic staining; p16 negative, no tumor cell staining or staining in <50% of tumor cells).