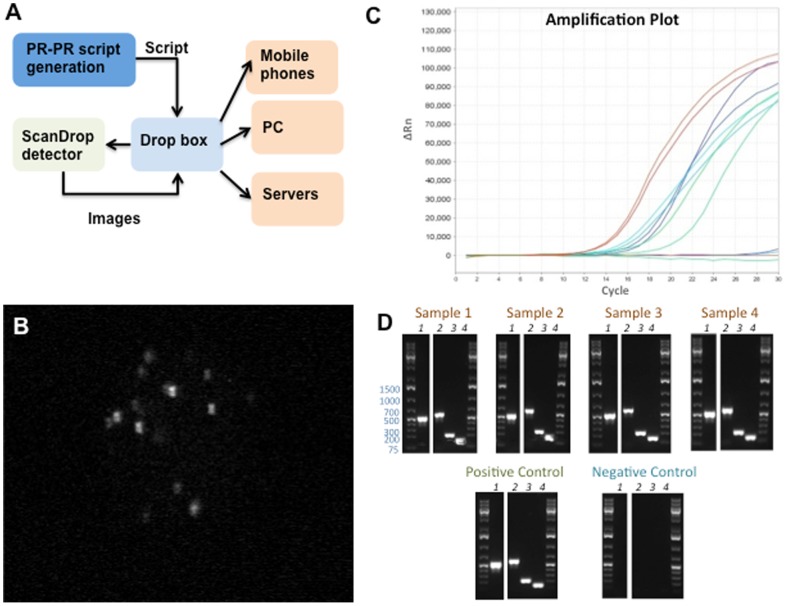
Figure 5. Detection of fecal E. coli in drinking water.
A) ScanDrop detection network. PR-PR generates a Python script to control the ScanDrop detector. The Python script is uploaded to Dropbox, and then run on the ScanDrop detector. The captured images are uploaded to Dropbox, and then distributed to various devices. B) Representative ScanDrop image demonstrating fecal E. coli detection in drinking water. C) Real-time PCR amplification plot for contaminated sample 3, and positive and negative controls. Red curves indicate amplification of primary 16S rRNA locus, cyan amplification of secondary 16S rRNA locus, green tuf locus, and blue uidA locus. Sample 3 and the positive control amplified similarly. The negative control did not amplify. D) Gel electrophoresis analysis of PCR reaction products for the four contaminated samples, along with positive and negative controls. For all samples, gel lanes correspond to the amplification of loci as follows: lane 1 - 16S rRNA primary locus, lane 2 - 16S rRNA secondary locus, lane 3 - tuf, lane 4 – uidA.

