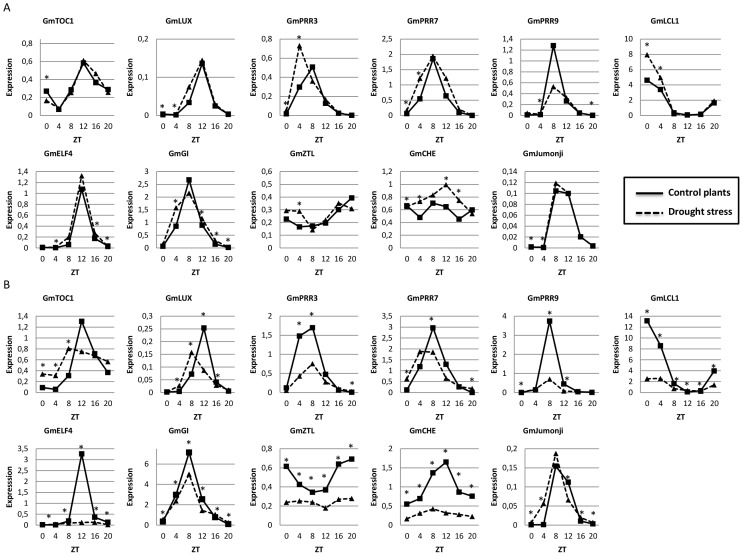
Figure 1. Drought affects the expression of some circadian clock genes in soybean.
Gene expression data regards qPCR analysis of soybean leaves during moderate (A) and severe (B) drought stress. Expression axis represents normalized expression (NE) = 2∧-(Ct experimental – Ctn). Collect time points are represented by ZT (Zeitgeiber Time) 0 to 20, starting from the time the lights came on ( ZT0) and proceeding with 4 h intervals until ZT20. For easy viewing, asterisks represent significant differences between control and stressed plants in each time point (Duncan’s test 5%, time -treatment interaction). The ANOVA and the complete Duncan’s test results are presented in Table S3.

