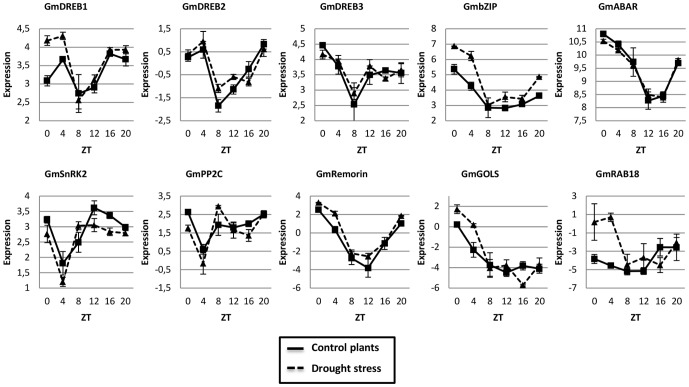
Figure 3. The diurnal oscillation of drought-responsive genes in soybean leaves during moderate stress is confirmed by RNA-seq analysis.
Collect time points are represented by ZT (Zeitgeiber Time) 0 to 20, starting from the time the lights came on ( ZT0) and proceeding with 4 h intervals until ZT20. The error bars represent the standard error. The ANOVA and the Tukey HSD (95% family-wise confidence level) multiple comparison tests can be found in Table S4.

