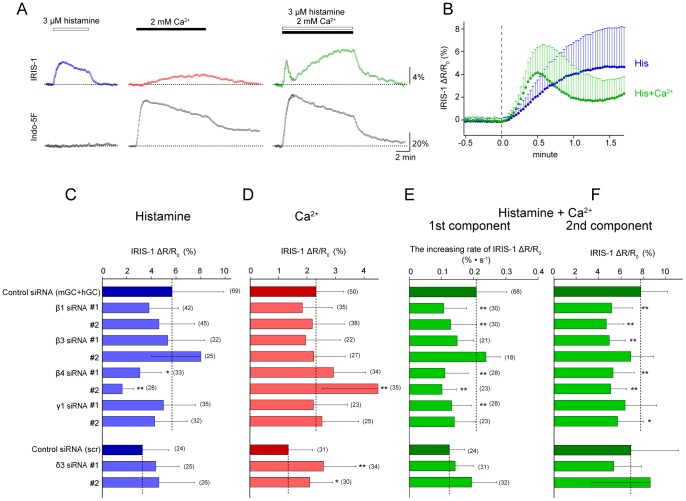
Figure 4. Identification of PLC isozymes involved in IP3 generation in HeLa cells stimulated with histamine.
(A) Representative traces of IRIS-1 signal changes (ΔR/R0; top) and Indo-5F signal changes (F/F0; bottom) observed in thapsigargin-treated HeLa cells. The horizontal broken lines indicate the baseline levels. (B) Traces of the mean ± SD IRIS-1 signal changes (ΔR/R0) observed in thapsigargin-treated HeLa cells after addition of 3 µM histamine (blue circles) or 3 µM histamine plus 2 mM Ca2+ (green circles). (C–F) Effects of PLC isozyme knockdown on the IP3 increase evoked by 3 µM histamine alone (C), the IP3 increase evoked by 2 mM Ca2+ alone (D), the first component of the IP3 increase evoked by 3 µM histamine plus 2 mM Ca2+, and the second component of the IP3 increase evoked by 3 µM histamine plus 2 mM Ca2+. Data are shown as means ± SD. The numbers of cells measured are shown in parentheses. Statistical analyses were performed by one-way ANOVA followed by Scheffe’s multiple comparison test. *P<0.05, **P<0.01, vs. the values in control siRNA-transfected cells.

