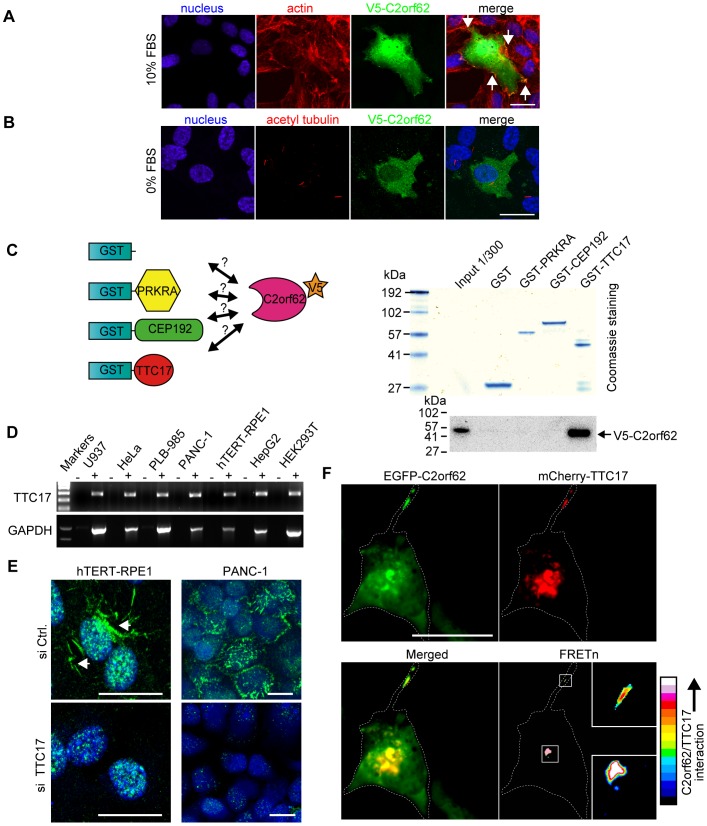
Figure 4. C2orf62 interacts with TTC17 in mammalian cells.
(A) When overexpressed in hTERT-RPE1 cells grown at 10% FBS, V5-C2orf62 localizes in the cytoplasm, nucleus and in F-actin-rich zones of the plasma membrane (arrows). See also EGFP-C2orf62 live cell imaging in movie S1. (B) Ciliogenesis was induced by serum starvation in hTERT-RPE1 cells transfected with V5-C2orf62. V5-C2orf62 (green) was not detected in cilia visualized using anti α-acetylated tubulin (red). Scale bars, 25 µm. (C) Beads coated with GST, PRKRA-GST, CEP192-GST and TTC17-GST were used for pull-down experiments on V5-C2orf62-transfected HEK293T cell lysates. V5-C2orf62 only bound to TTC17-GST beads. See also Table S1. (D) RT-PCR showing TTC17 expression in every tested cell line (U937, HeLa, PLB-985, PANC-1, hTERT-RPE1, HepG2 and HEK293T). GAPDH was assessed in parallel for comparison. (E) Subcellular localization of endogenous TTC17 was studied by immunofluorescence on hTERT-RPE1 and PANC-1 cells transfected either with a control siRNA (si Ctrl) or with siRNA against TTC17 (si TTC17). Despite a strong background staining in the nucleus, a specific staining that disappeared with si TTC17 treatment could be seen in hTERT-RPE1 cells (see also Fig. S3). The staining was more intense, with less background, in PANC-1 cells. Scale bars, 25 µm. (F) hTERT-RPE1 cells were co-transfected with EGFP-C2orf62 and mCherry-TTC17 (red) and observed 24h later by confocal microscopy. Both fusion proteins were enriched in the same areas, including cell surface protrusions. The pseudocolor images represent FRET signals corrected for bleed-through using the normalized FRET method (FRETn), with white and red indicating higher interaction levels. Colocalisation was detectable by FRETn, suggesting a stable interaction. Scale bars, 25 µm.

