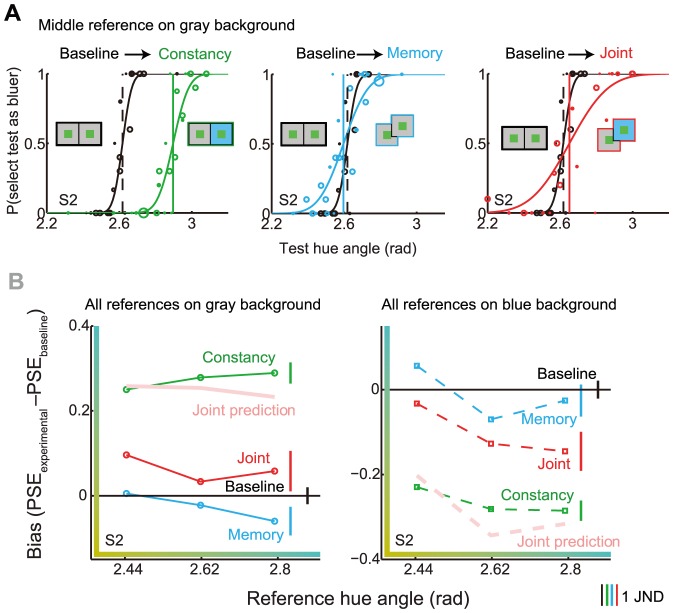
Figure 4. Estimating appearance and precision from psychometric functions.
A) Example psychometric functions are shown for a representative observer for the middle green reference. Within each panel, the cumulative normals show the probability of selecting the test stimulus as bluer as a function of test hue (larger hue angles correspond to bluer hue appearance). The black curves in all panels show the same baseline data. The colored curves show the data from the labeled condition. The vertical dashed lines show the reference hue, that is, the veridical match, whereas the solid vertical lines show the actual matches (PSEs). Bias is defined as the difference between the dashed and solid lines. The slopes of the psychometric functions indicate precision. B) The appearance shifts (bias) are shown for each of the three reference stimuli in each condition (labeled). The right-hand panel shows data for those trials where the reference stimulus was on the gray background and the test on the gray (baseline, memory), or on the blue background (constancy, joint). The left-hand panel shows data from those trials where the reference was on the blue background and the test on the blue (baseline, memory), or on the gray background (constancy, joint). As the bias in each condition was calculated relative to the PSE in the baseline condition, the baseline bias (black horizontal line) is always zero. The vertical line segments on the right indicate threshold hue angles (JND’s) in each condition averaged over reference stimulus. Longer lines indicate decreased precision. Figure S2 shows data for all observers.

