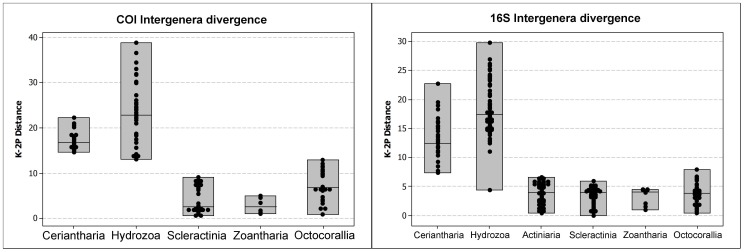
Figure 2. Estimates of evolutionary divergence in major Anthozoan lineages (intergenera level, Hydrozoa considered as outgroup for discussion) from mitochondrial molecular markers.
Right graph: estimates of evolutionary divergence (K2-P) of COI between species of different genera in Ceriantharia (n = 8), Hydrozoa (n = 12), Scleractinia (n = 10), Zoantharia (n = 4) and Octocorallia (n = 8) (n = number of species examined). Left graph: estimates of evolutionary divergence (Kimura 2-parameter model) of 16S ribosomal DNA between species of different genera in Ceriantharia (n = 9), Hydrozoa (n = 13), Actiniaria (n = 12), Scleractinia (n = 11), Zoantharia (n = 5) and Octocorallia (n = 11) (n = number of species).

