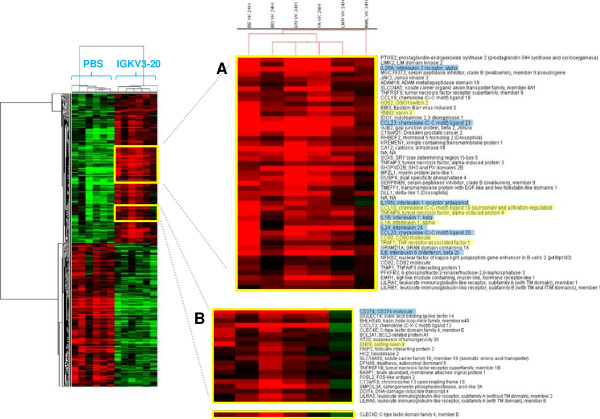
Figure 2.
Supervised analysis based on IGKV3-20 induction at 24 h. Heat map of gene sets differentially modulated by IGKV3-20 after 24 h. The heat map in (A) shows several genes whose expression is strongly up-regulated in PBMCs of BE. The heat map in (B) shows several genes whose expression is down-regulated in PBMCs of MML after IGKV3-20 stimulation. Genes highlighted in yellow are mostly activated in sample BE. Genes highlighted in blue are activated in all HCV-positive samples, with exception of MML.

