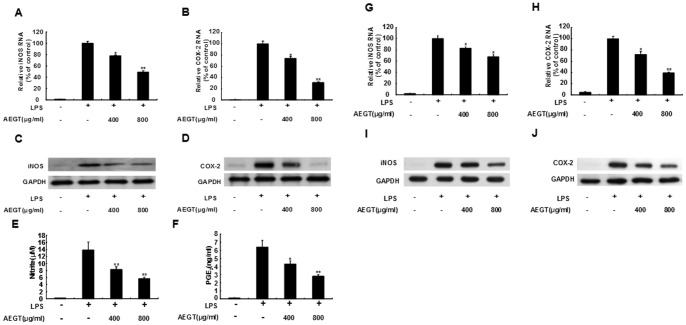
Figure 2. Effect of AEGT on NO/PGE2 production and iNOS/COX-2 expression in LPS-stimulated RAW 264.7 cells (A–E) and primary rat peritoneal macrophages (G–J).
Cells were seeded in a 24-well plate, treated with 400 or 800 µg/ml AEGT for 1 h, and then incubated with 1 µg/ml LPS for 24 h. The cell lysates were collected to determine the RNA (A, B, G and H) and protein (C, D, I and J) levels of iNOS and COX-2 by qRT-PCR with specific primers and western blot analysis with antibodies against iNOS and COX-2, respectively. The efficiency of inhibition was determined as the percent RNA levels relative to those in the cells treated with LPS alone. The supernatant was collected to quantify NO (E) and PGE2 (F) levels using Griess reagents and an ELISA kit, respectively. Error bars indicate the means ± SD of three independent experiments. *P<0.05; **P<0.01.

