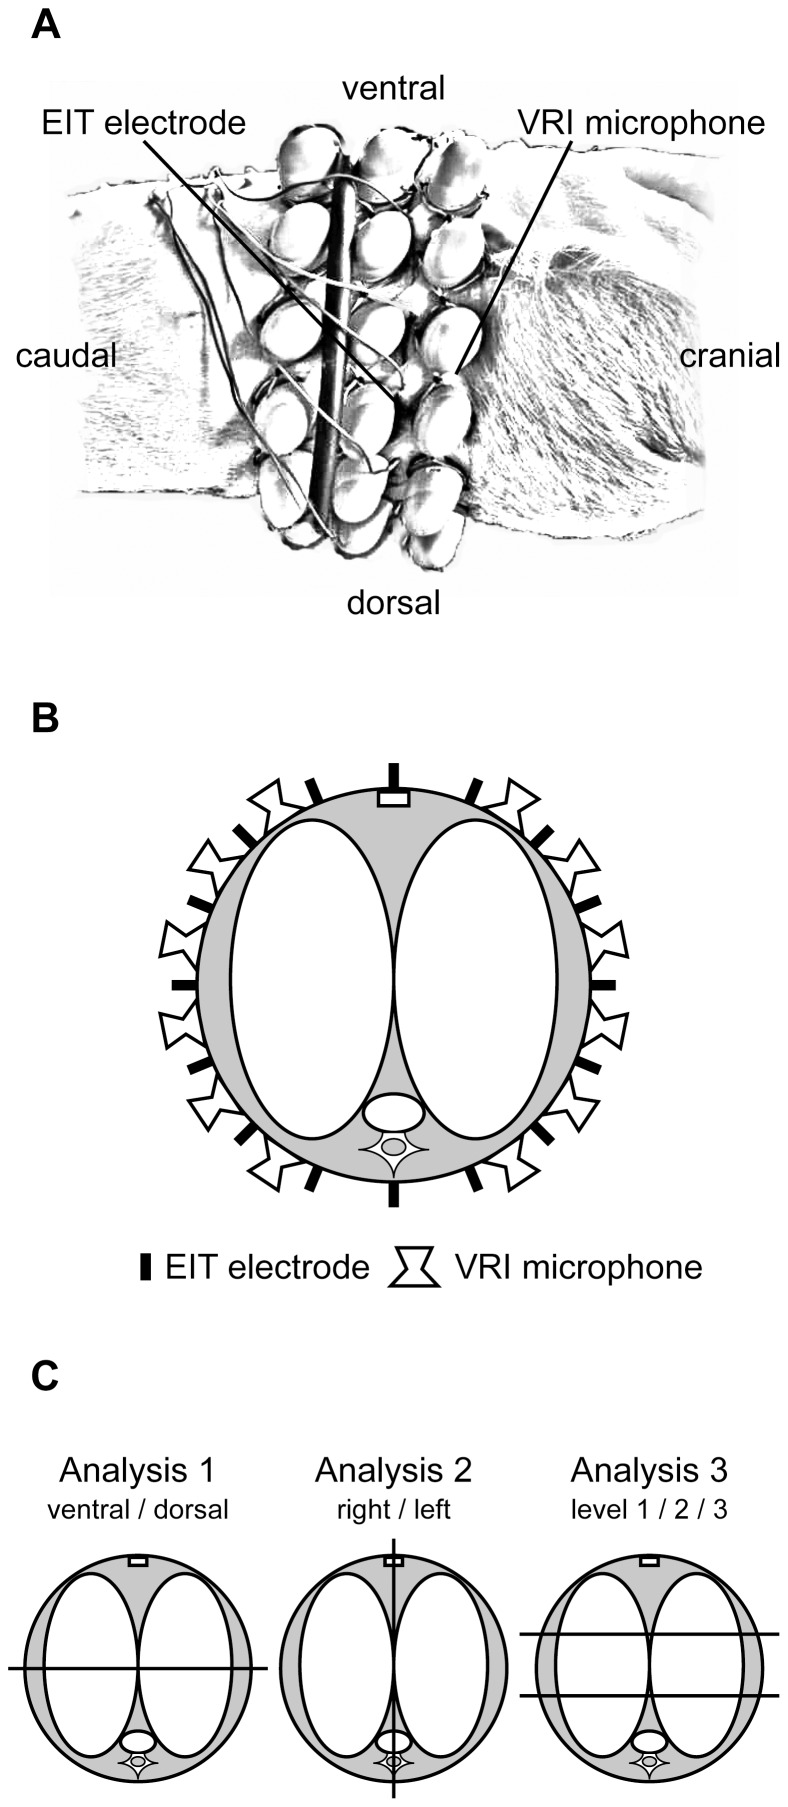
Figure 1. Anatomical sensor position of VRI and EIT.
Panel A shows the lateral view of the attached VRI and EIT sensors (derived from photography). Panel B displays schematically the sensor positions in the observed lung cross section. Panel C shows the analyzed ROIs: Therefore, VEA was calculated by the sum of all relevant microphones within the predefined ROIs in accordance to the anatomic position. The three upper rows covered the ventral part, and the three lower rows covered the dorsal part of the lung. The right or left array covered the right or left lung, respectively. For the three transverse ROIs, the two upper microphone rows covered the upper ventral (level 1), the third and fourth rows the middle (level 2), and the fifth and six rows the lower dorsal (level 3) ROIs.

