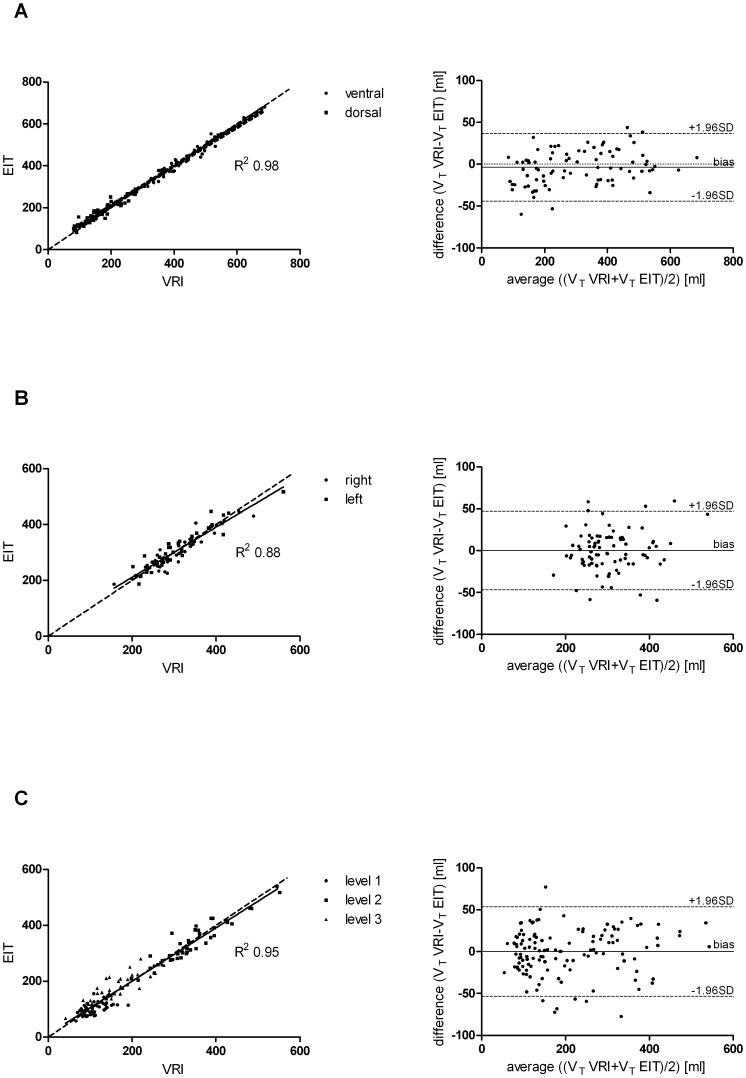
Figure 4. Linear regression plots of estimated VT values by EIT vs. VRI.
Linear regression plots of estimated VT values by EIT versus VRI (solid line represents the line of best fit; dashed line shows the identity line) with the corresponding Bland-Altman plots, displaying differences of VRI and EIT VT measurements versus the average (solid line shows the bias; dashed line the limits of agreement). Panel A: Analysis 1 for ventral and dorsal lung regions of interest (ROI). Panel B: Analysis 2 for right and left ROI. Panel C: Analysis 3 for level 1 (upper ventral), level 2 (middle), and level 3 (lower dorsal) ROIs.

