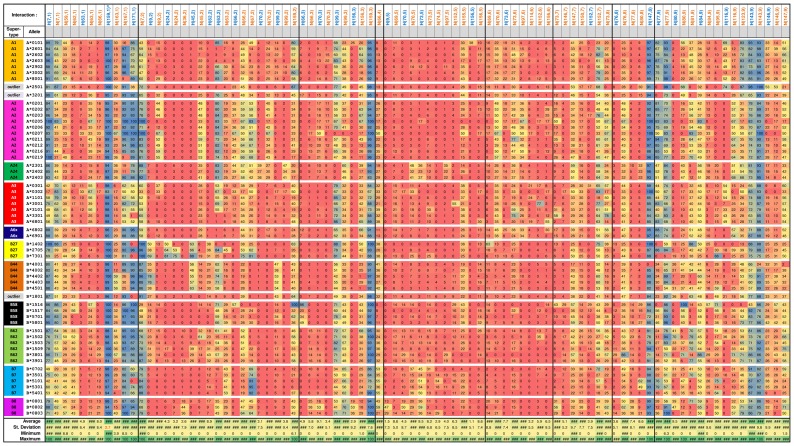
Figure 1. Heatmap of HLA-peptide interaction supports.
HLA-A and -B alleles are sorted according to their assigned superfamilies and then by their allelic name. HLA-peptide interactions are sorted according to the interacting position on peptide ligand and then the position on the HLA molecule. The 88 columns consist of the 87 interactions with more than 5% standard deviation in their supports and H(159,1), which has exceptionally high supports (average of 97.5%) with low standard deviation (2.74%). Each interaction support value is color coded from red (0% support) to blue (100% support). The interactions are sorted from left to right; first by peptide position then by HLA position involved in the interaction.

