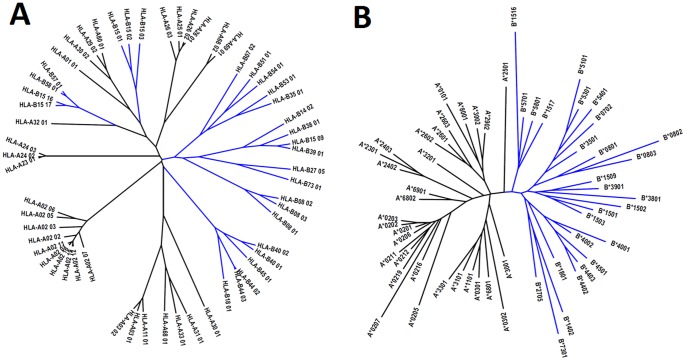
Figure 4. Dendrogram showing HLA-A and -B clusters generated using A) MHCcluster 2.0 Server [22], and B) our proposed method for the 58 alleles used in this study.
Clear separation of HLA-A and -B alleles into well resolved, non-overlapping clusters could be obtained using our classification method, but not using the MHCcluster method. Blue: HLA-B alleles, black: HLA-A alleles.

