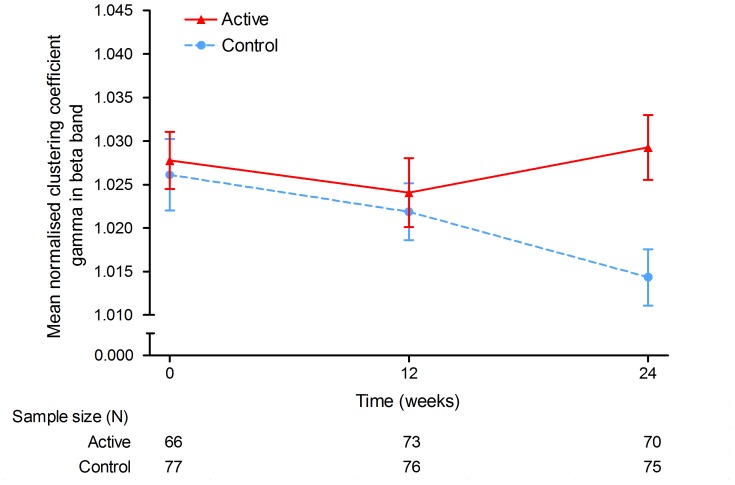
Figure 4. Local clustering of AD functional networks.
The normalised clustering coefficient gamma in the beta band during 24-weeks intervention was significantly different between the groups. Blue, dotted line: control product; red, solid line: Souvenaid. X-axis: time (weeks), y-axis: gamma in beta band. Error bars represent standard errors of the mean.

