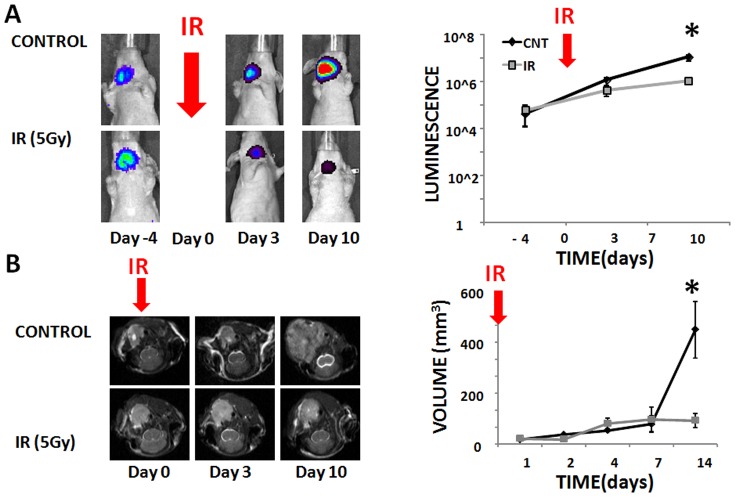
Figure 1. IR decreases but does not arrest ATC growth.
A) ATC tumors were allowed to grow under control conditions or following irradiation (IR) (5 Gy single fraction) administered at Day 0. Tumors were imaged using Xenogen imaging prior to and following irradiation (please note y-scale is logarithmic). B) ATC tumors were imaged at multiple points during the experimental period and tumor volume calculated as a product of the largest dimensions in the axial, sagittal and coronal planes. Error bars indicate standard deviation and *denotes p-value <0.05 compared to control for the specific time point using two-tailed Student’s t-test.

