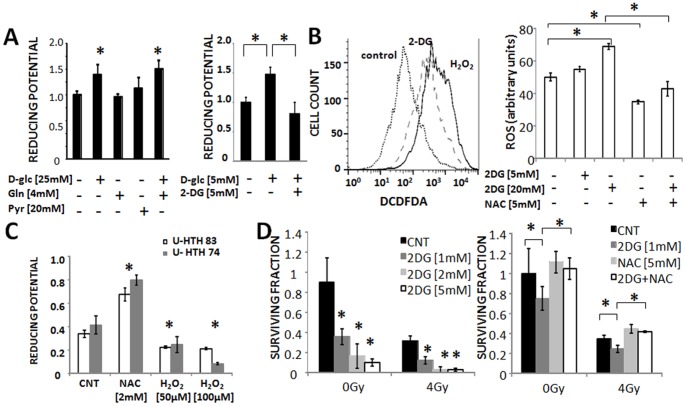
Figure 3. Glucose catabolism controls ATC reducing potential and ROS levels.
A) ATC (U-HTH7) cellular reducing potential is maintained largely through glucose catabolism. B) ATC (U-HTH83) inhibition of glucose catabolism using 2-deoxyglucose (2-DG) increases intra-cellular ROS levels in a dose dependent fashion. C) ROS perturbations trigger changes in cellular reducing potential. D) Inhibition of glucose catabolism radiosensitizes ATC cells (U-HTH83) in a dose dependent manner. These effects are reversed by NAC. Data are presented as averages with error bars representing standard deviation. Each experiment was performed at least in duplicate. *indicates p-value <0.05 compared to corresponding control condition unless otherwise indicated. (CNT = control, DCFDA = 2′,7′-dichlorodihydrofluorescein diacetate).

