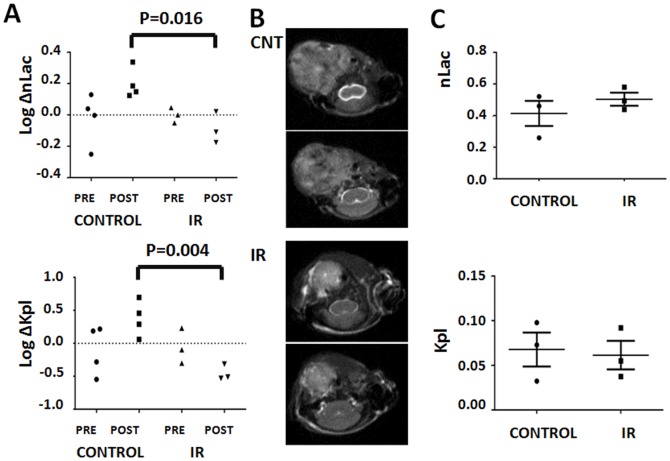
Figure 6. HP-MRS can detect both acute and chronic IR induced changes in ATC reducing potential.
A) Control (n = 4) and irradiated (5 Gy) (n = 3) tumors were imaged pre- and post- IR (or sham). Generation of labeled lactate (nLac) and conversion rate constants (Kpl) were calculated and changes from first to second measurement were recorded. B) Control and irradiated ATC tumors demonstrating difference in size using anatomic imaging (T2 weighted sequential slices). C) Reducing potential levels in control (n = 3) and irradiated (n = 3) tumors at 2 weeks post irradiation (5 Gy).

