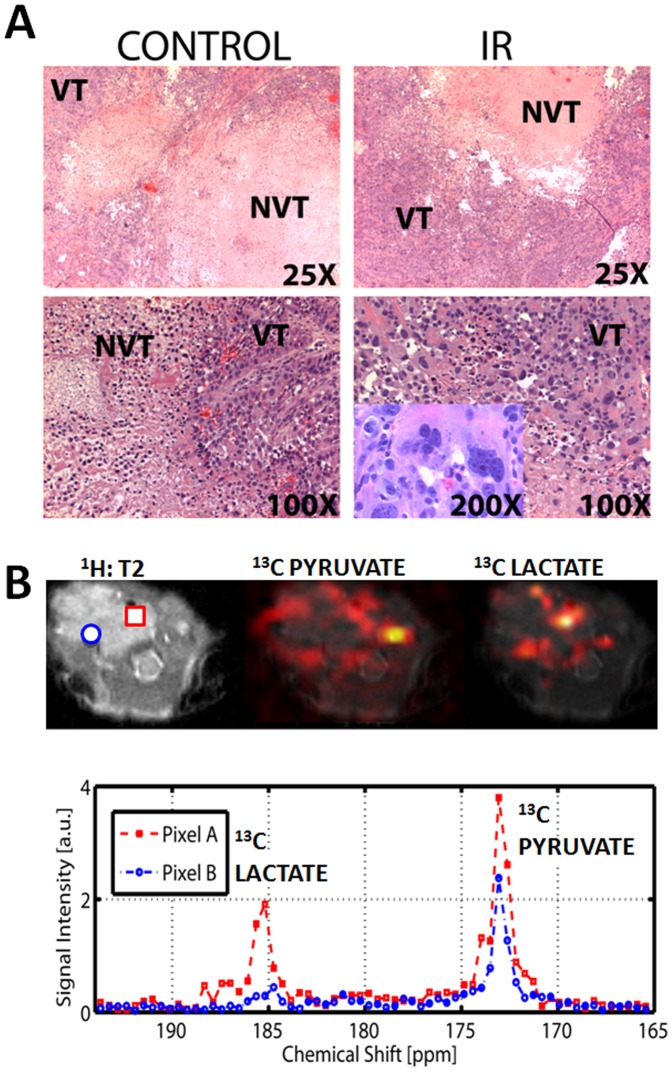
Figure 7. ATC tumors display significant metabolic heterogeneity.
A) Control and irradiated tumors (IR) were serially sectioned and H&E staining was used to evaluate overall tumor architecture. Control tumors were substantially larger, but the majority of the tumor core consisted of non viable tissue (NVT). In contrast the majority of the irradiated tumor volume consisted of apparently viable tissue (VT). Irradiated tumors exhibited a high degree of aberrant cellular morphology as illustrated in the right lower panel inset. B) ATC tumor imaged at 2 weeks following tumor cell injection. Single snapshot imaging was performed 20 seconds after injection of labeled pyruvate. Spatial heat maps were generated from raw data and superimposed onto T2 weighted anatomic images for both pyruvate and lactate. Chemical spectra obtained in two separate voxels demonstrating differential conversion of pyruvate into lactate are shown.

