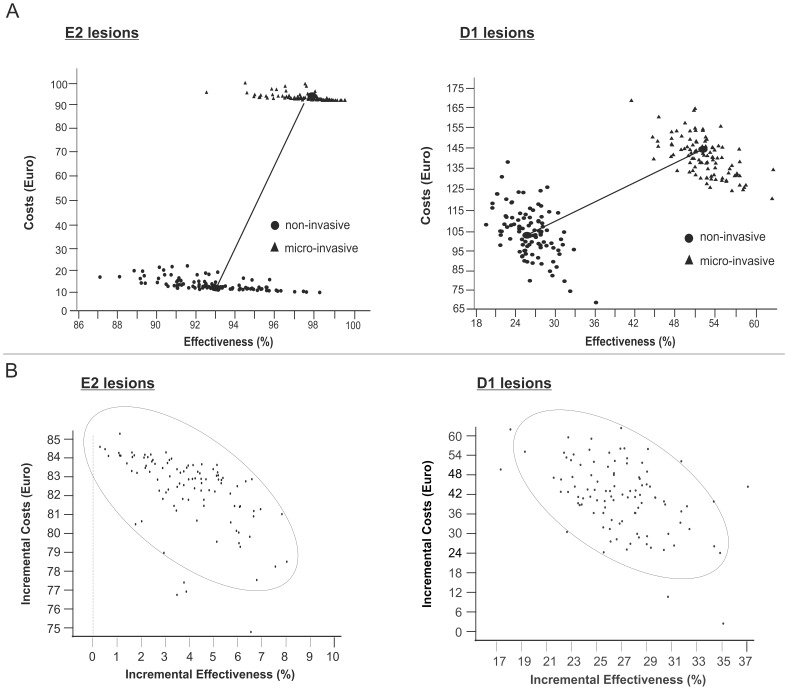
Figure 2. Cost-effectiveness of different treatment strategies.
2a: Cost-effectiveness-planes of non- and micro-invasive treatment of E2 (left) and D1 lesions (right). Horizontal and vertical axes represent effectiveness (% of unrestored lesions over lifetime) and lifetime treatment costs (€), respectively. For non-invasive and follow-up treatments, parameter uncertainty was introduced by random sampling from a triangular distribution within the 95% Confidence Interval. Effects of uncertainty related to micro-invasive treatment were explored using scenario analyses (see Table 3). Non-invasive treatment was less costly and less effective than micro-invasive treatment. Regardless of the initial treatment, progression of E2 lesions occurred at later stages of life and in only few lesions, with low costs for such late re-treatment due to discounting effects. Micro-invasive treatment prevented progression of an additional 4.7% of E2 lesions compared with non-invasive treatment. The low effectiveness gain at high additional costs made micro-invasive treatment less cost-effective for E2 lesions. D1 lesions had higher transition probabilities after both treatments than E2 lesions. Micro-invasive treatment prevented the progression of an additional 27.0% of D1 lesions compared with non-invasive treatment, resulting in a more pronounced effectiveness advantage. 2b: Incremental cost-effectiveness planes. Horizontal and vertical axes illustrate the effectiveness- and cost-differences between micro- compared with non-invasive treatment. The ellipses represent 95% confidence intervals. Micro-invasive treatment was more costly and effective than non-invasive therapy for both E2 (left) and D1 lesions (right). Consequently, all ICERs are found in the north-eastern quadrant. Cost-differences were higher for E2 lesions, whilst effectiveness-differences were higher for D1 lesions.

