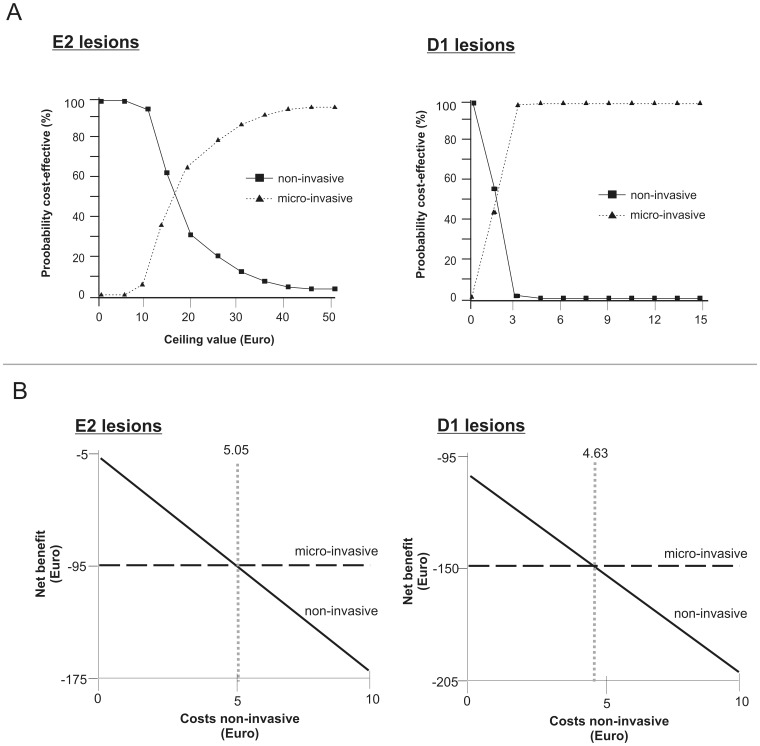
Figure 3. Cost-acceptability and net-benefit of different treatment strategies.
3a: Cost-effectiveness-acceptability curves. For each strategy, the probability of being cost-effective is plotted against a ceiling value (€). This value reflects the maximum a decision-maker is willing to invest to achieve an additional unit of effectiveness [20]. By increasing the ceiling value, the higher initial treatment costs of micro-invasive therapy become less important and its probability of cost-effectiveness increases. For E2 lesions, both non- and micro-invasive treatment were found to have an equal chance of cost-effectiveness at a threshold of 16.73€. Below this ceiling value, non-invasive treatment would be more likely to be cost-effective, whilst micro-invasive treatment has a higher probability of being cost-effective above that value. This value was reduced to 1.57 € for D1 lesions: These lesions had higher transition probabilities, and micro-invasive treatment prevented progression of considerably more D1 than E2 lesions (27.0% compared with 4.7%) in comparison with non-invasive treatment. This increased effectiveness resulted in a lower ceiling value threshold for D1 compared to E2 lesions. 3b: Net benefit curves. Net benefit of non- and micro-invasive treatment for E2 (left) and D1 lesions (right) depending on the costs for non-invasive therapy was calculated assuming a willingness-to-pay ceiling value of 0 €. If non-invasive therapy was more costly than 5.05 € or 4.63 €, respectively, micro-invasive treatment had the higher net benefit.

