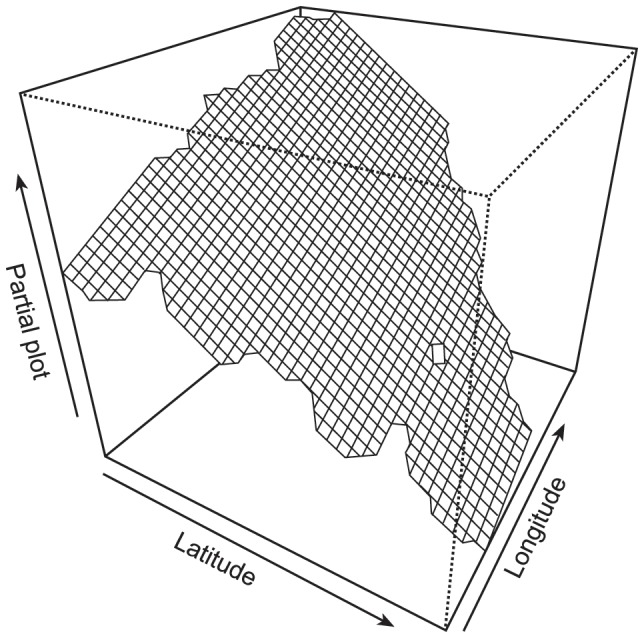
Figure 3. Example partial plot visualisation of the Latitude Longitude smoother used in the GAMM with total moth abundance as the response variable.

Total abundance was highest in the SE of Britain (compare against map of Britain in Figure 1).

Total abundance was highest in the SE of Britain (compare against map of Britain in Figure 1).