
Figure 6. SyMap dot plot of alignment between P. semeniperda scaffold 1 and P. tritici-repentis 2, 3, 6 and 10.
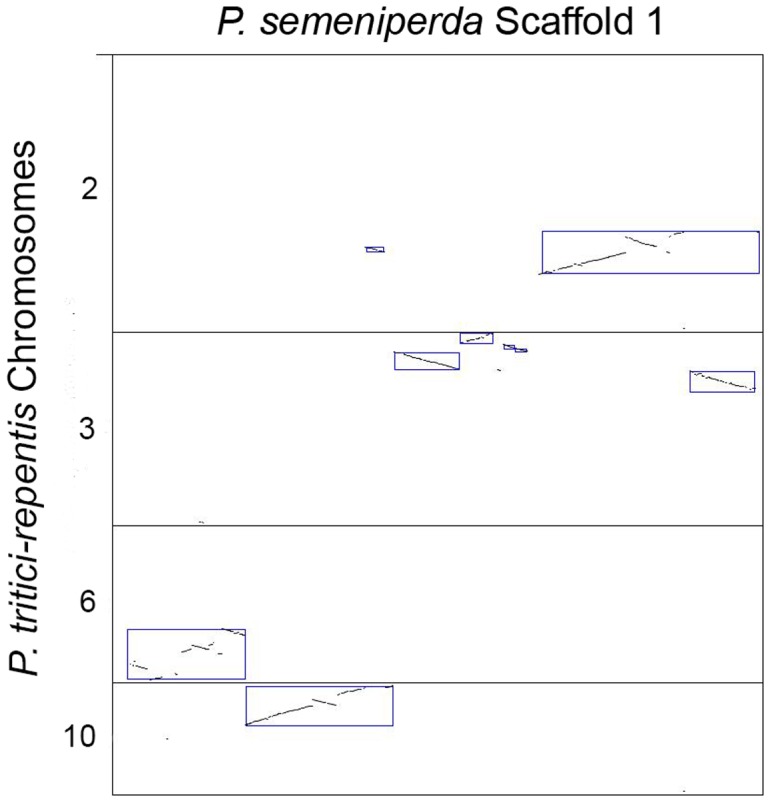
The P. semeniperda scaffold is displayed along the x-axis and the P. tritici-repentis chromosomes along the y-axis. Boxes highlight regions of homology between the two genomes.