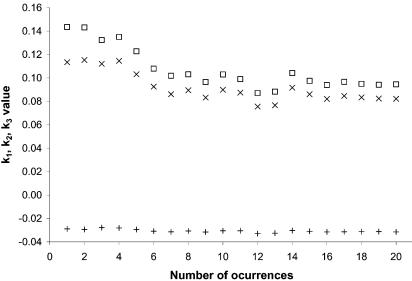
Figure 4.
Variation of the fitting parameters (equation 1) for the distance-based map as a function of the minimum number of occurrences. Crosses indicate parameter k1 values, open boxes indicate parameter k2 values and plus signs indicate parameter k3 values. This graph is based on the training set of 887 intra-TU distances and 502 inter-TU distances from E.coli and B.subtilis as described in the text.

