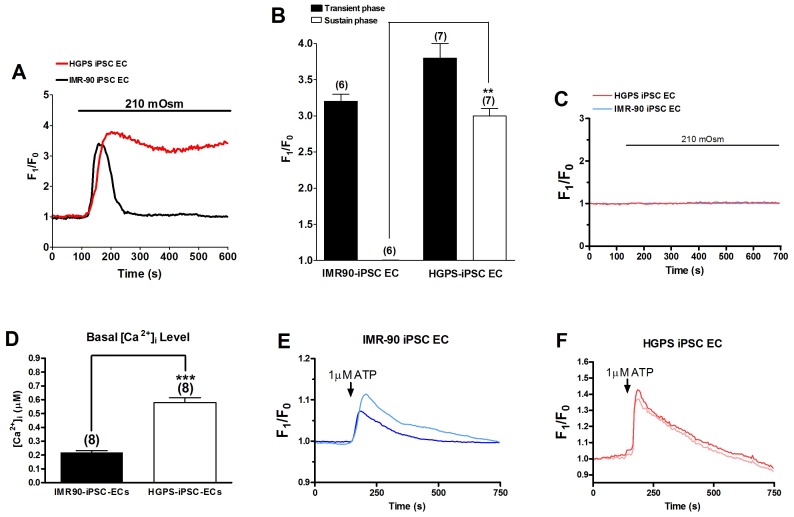
Figure 1. Effect of hypotonicity and ATP on [Ca2+]i in IMR90-iPSC-ECs and HGPS-iPSC-ECs.
(A and B), Representative traces (A) and data summary (B) showing the effect of hypotonicity (210 mOsm) on [Ca2+]i (fluorescence ratio F1/F0) in IMR90-iPSC-ECs and HGPS-iPSC-ECs bathed in isotonic solution. n = 6-7 experiments. (C), Representative traces showing the effect of hypotonic solution (210 mOsm) on [Ca2+]i in cells bathed in Ca2+-free isotonic saline. n = 8 experiments. D. Basal [Ca2+]i level in IMR90-iPSC-ECs and HGPS-iPSC-ECs as determined by Fura-2 dye. n = 8. ** p<0.01 unpaired t-test compared with the sustained [Ca2+]i level in IMR90-iPSC-EC group in B or compared with basal [Ca2+]i level in D. (E and F), Representative traces showing the effect of ATP (1 µM) on [Ca2+]i in cells bathed in normal physiological saline. Representative from 3 experiments.

