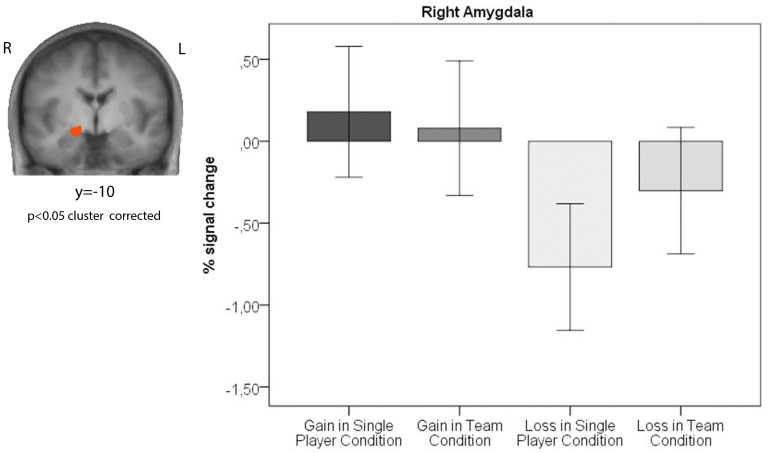
Figure 4. Amygdala activity encoding relative valence and context of outcomes during the outcome evaluation period.
The coronal slice shows the interaction effect between outcome (gain/loss) and social setting (single-player condition/team condition) in the right amygdala. The bar graphs indicate the percent signal change (±SE) for the right amygdala (x = 20, y = –1, z = –7; size = 1065 voxels).

