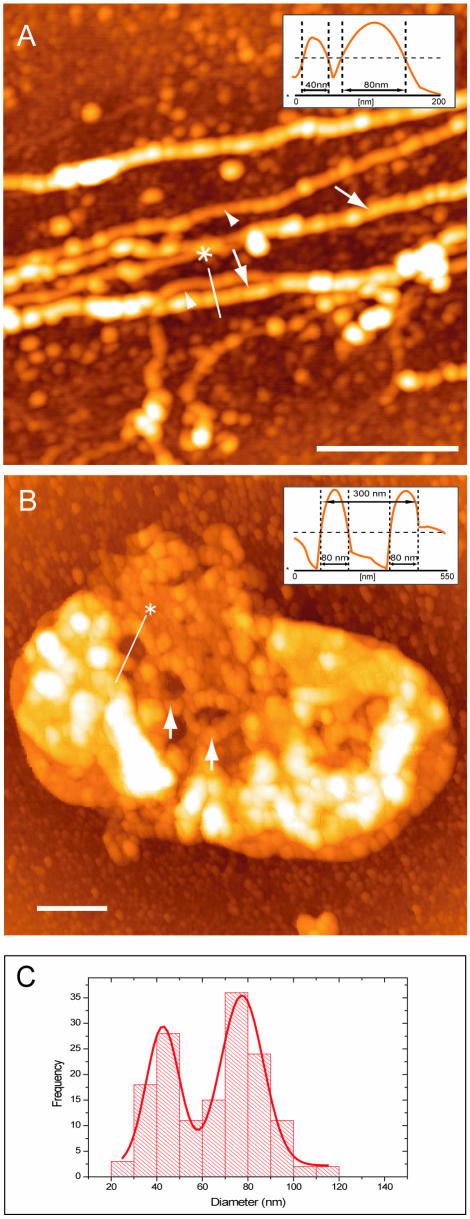
Figure 2.
Fundamental structural units of the nucleoid. A closer observation of the nucleoid in the log phase revealed two different fibers with 40 nm (A, arrowheads) and 80 nm (A and B, arrows) widths. The solid lines represent the sites of section analysis that are depicted in the upper right corner of the image. The horizontal dotted lines on section analysis images indicate the half-maximum height. The histogram of the fiber width, together with a Gaussian-fitting curve, is depicted in (C) (bin size, 10 nm). The 80 nm fiber forms the loop structure (arrows, inside diameter 149.53 ± 13.06 nm, mean ± SD) in a partially lysed nucleoid in the log phase (B). Scale bars, 500 nm.

