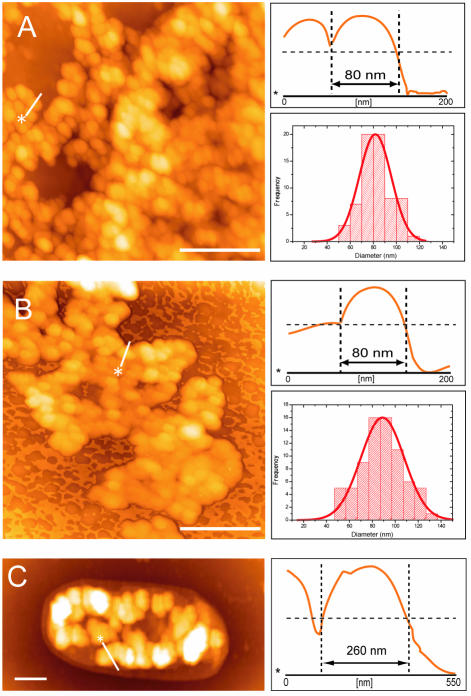
Figure 3.
Tight packing of the nucleoid. Closer observations of the nucleoids in the lag (A) and early stationary (B) phase revealed the 80 nm granular structures. The solid lines represent the sites of section analysis that are depicted in the right upper panels. The horizontal dotted lines on section analysis images indicate the half-maximum height. The diameters of the granules were measured and are summarized in the right bottom panels (bin size, 10 nm). A peak curve obtained by Gaussian fitting was overlaid in each histogram. The peak-to-peak distance of adjacent beads in AFM images (B) was also measured and appeared to be ∼80 nm (78.58 ± 20.13 nm, mean ± SD). A thick fiber in a tightly compacted nucleoid (C) was observed in the late stationary phase. The solid line in the AFM image represents the sites of section analysis that are depicted in the right panel. Scale bars, 500 nm.

